 Skarp
Skarp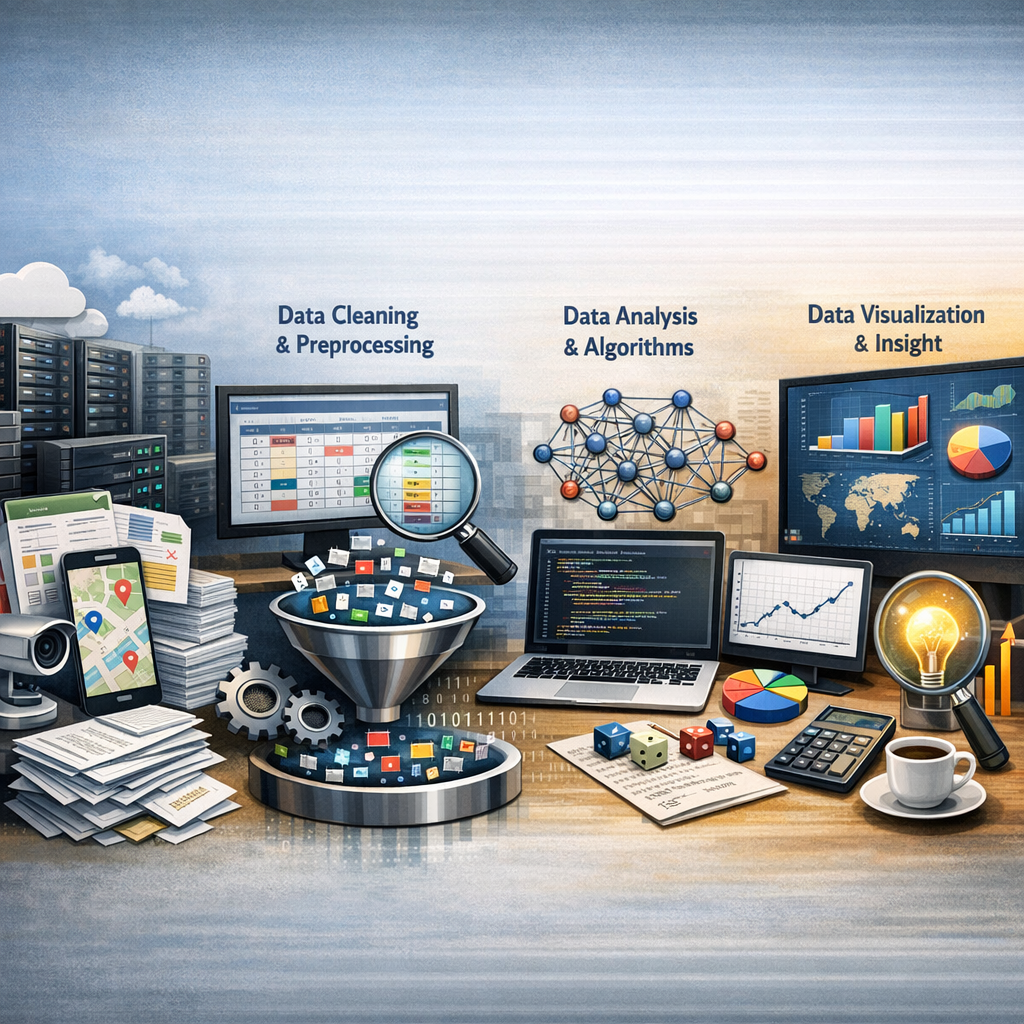
Data Science Foundations: From Raw Data to Insight
This course builds a solid foundation in modern data science, starting from zero. You’ll discover what data science is (and isn’t), how the end-to-end workflow works in practice, and the core ideas in data types, descriptive statistics, probability, and basic analytics vs. machine learning—so you’re ready to move into hands-on Python, Jupyter, and modeling next.
Course Content
9 modules · 2h 15m total
What Is Data Science, Really?
Step into the world of data science by seeing how companies turn messy real‑world data into decisions, products, and predictions—and why this field sits at the crossroads of math, coding, and domain expertise.
The Data Science Workflow: From Question to Value
Follow the journey of a data project from a vague question to a concrete, data‑driven insight, seeing how each stage connects and where projects often succeed—or fail.
Knowing Your Data: Types, Structure, and Quality
Peek inside real datasets to see how numbers, categories, text, and timestamps are represented—and why understanding structure and quality is essential before any analysis or modeling.
Descriptive Statistics: Summarizing Data at a Glance
See how a few numbers and simple charts can tell rich stories about data, revealing patterns, typical values, and variability long before any machine learning is involved.
Probability and Uncertainty: Thinking in Chances
Move beyond gut feeling by learning to think in terms of chances, events, and likelihoods—building the intuition that underpins modern predictive models.
Analytics vs Machine Learning vs AI: Cutting Through the Buzzwords
Untangle the hype by clearly separating classic analytics, modern machine learning, and broader AI, and see when each approach actually makes sense.
From Real-World Questions to Data Problems
Watch messy business or research questions be transformed into clear, answerable data problems with defined metrics, targets, and constraints.
Meet the Tools: Python, Jupyter, and Core Data Libraries
Get a guided tour of the modern data scientist’s toolkit, seeing how Python, Jupyter notebooks, and key libraries fit together in a typical workflow—without yet writing real code.
Responsible Data Science: Ethics, Bias, and Real-World Impact
Look under the hood of data-driven systems to see how biased data, poor design, or opaque models can harm people—and how thoughtful practices can reduce these risks.
Read the Textbook
Read every chapter for free, right here in your browser.
Data science is about turning messy, real-world data into useful decisions, products, and predictions.
A simple way to think about it:
Data science = data + math & stats + coding + domain knowledge Data: numbers, text, images, clicks, sensor readings, etc. Math & statistics: tools to find patterns and measure uncertainty. Coding: using programming (often Python or R) to work with data at scale. Domain knowledge: understanding the business, science, or social context so results are meaningful.
Study Flashcards
Key concepts from this course as flashcard pairs.
What Is Data Science, Really?
Data science
An applied field that uses data, math/statistics, coding, and domain knowledge to turn messy real-world data into useful insights, predictions, and decisions.
Descriptive analytics
Type of analysis that answers "What happened?" by summarizing past data with counts, averages, charts, and dashboards.
Predictive analytics
Type of analysis that answers "What is likely to happen?" by using models trained on past data to predict future or unknown outcomes.
Prescriptive analytics
Type of analysis that answers "What should we do?" by recommending actions (such as prices, routes, or assignments) to achieve a goal.
Data scientist
A role focused on exploring data, building and evaluating models, running experiments, and communicating results to guide decisions.
Data analyst
A role focused on querying data, building reports and dashboards, tracking KPIs, and answering business questions with clear numbers and charts.
+3 more flashcards
The Data Science Workflow: From Question to Value
Problem definition
The stage where a vague idea (like "use AI to improve the app") is turned into a clear, answerable question with a defined goal, metric, and constraints.
Stakeholder
Any person or group affected by a data project or using its results, such as business leaders, product managers, engineers, legal teams, or end users.
Data discovery
The process of finding, understanding, and getting access to relevant data sources for a project, including checking availability, quality, and legal constraints.
Data cleaning
Fixing, removing, or standardizing incorrect, missing, or inconsistent data so that analyses and models are reliable.
Exploratory data analysis (EDA)
Early analysis using summaries and visualizations to understand distributions, relationships, and potential problems in the data.
Feature engineering
Creating meaningful input variables (features) from raw data, such as turning raw logs into "sessions per week" or "failed payments last 3 months".
+4 more flashcards
Knowing Your Data: Types, Structure, and Quality
Structured data
Data organized in tables with rows and columns, where each column has a defined type (for example, a spreadsheet of sales with price and date).
Semi-structured data
Data with some organization (like JSON or XML) but not a fixed table schema; different records can have different fields.
Unstructured data
Data without a predefined tabular structure, such as free text, images, or audio, which must be transformed before most analyses.
Continuous variable
A numeric variable that can take many values on a range (for example, height, temperature, price).
Discrete variable
A numeric variable that takes separate values, often counts or integers (for example, number of purchases).
Categorical variable
A variable that represents groups or labels, not amounts; can be nominal (unordered) or ordinal (ordered).
+6 more flashcards
Descriptive Statistics: Summarizing Data at a Glance
Mean
The arithmetic average: add all values and divide by the number of values. Sensitive to extreme values (outliers).
Median
The middle value when data are sorted. If there is an even number of values, average the two middle ones. Robust to outliers.
Mode
The value that appears most frequently in the data. There can be more than one mode, or none if all values are equally frequent.
Range
A simple measure of spread: maximum value minus minimum value. Very sensitive to extreme values.
Variance
The average of the squared deviations from the mean. Measures how spread out values are around the mean.
Standard Deviation
The square root of the variance. Expresses typical distance from the mean in the same units as the data.
+5 more flashcards
Probability and Uncertainty: Thinking in Chances
Outcome
A single possible result of a process, like "Heads" in a coin toss or "4" in a die roll.
Event
A set of outcomes we care about, such as "even number" when rolling a die (outcomes {2, 4, 6}).
Probability
A number between 0 and 1 (or 0% to 100%) that measures how likely an event is to happen.
Independent events
Events where knowing one happened does not change the chance of the other (for example, two separate fair coin tosses).
Dependent events
Events where knowing one happened changes the chance of the other (for example, drawing cards without replacement).
Randomness
A property of processes where individual outcomes are unpredictable, but long-run patterns are stable.
+2 more flashcards
Analytics vs Machine Learning vs AI: Cutting Through the Buzzwords
Descriptive analytics
Analytics that answers **"What happened?"** by summarizing past data using counts, averages, percentages, and charts.
Diagnostic analytics
Analytics that answers **"Why did it happen?"** by looking for reasons and relationships in past data, often using comparisons and correlations.
Predictive analytics
Analytics that answers **"What is likely to happen?"** by using past data (often with ML) to estimate future outcomes.
Prescriptive analytics
Analytics that answers **"What should we do?"** by recommending actions or decisions based on predictions, goals, and constraints.
Machine learning (ML)
A set of methods that **learn patterns from data** to make predictions or decisions, instead of relying only on hand‑written rules.
Supervised learning
A type of ML that learns from **labeled examples**, where each input has a known correct answer (label), to predict labels for new inputs.
+4 more flashcards
From Real-World Questions to Data Problems
Real-world goal
A concrete change you want to see in the real world, such as fewer dropouts, more sales, or lower waiting times. It comes before any data or models.
Data task type
The general kind of problem you are solving with data, such as prediction, classification, estimation, segmentation, ranking, or causal comparison.
Target (outcome, label)
The specific thing you are trying to predict or explain, which is observable and usually tied to a clear time window.
Features (inputs)
Pieces of information known before the outcome, used to predict or explain the target, subject to timing, cost, legal, and ethical constraints.
Evaluation metric
A rule for scoring how well your solution works, such as accuracy, recall, average error, or a business impact measure.
Data leakage
A framing error where features include information that would not be available at decision time, often leading to unrealistically good performance in testing.
+1 more flashcards
Meet the Tools: Python, Jupyter, and Core Data Libraries
Python
A general-purpose programming language widely used for data science, machine learning, web development, and automation. It acts as the glue that connects data libraries and tools.
Jupyter Notebook
A web-based interactive environment where you combine code, text, and outputs (tables, charts) in one document, supporting experimentation, storytelling, and reproducible analysis.
NumPy
A core Python library for fast numerical computing, providing efficient n-dimensional arrays and vectorized operations. Many other data libraries are built on top of it.
pandas
A Python library for working with tabular data (DataFrames). It is used for loading, cleaning, transforming, and summarizing data from sources like CSV, Excel, and SQL.
Matplotlib
A plotting library for creating charts such as line, bar, histogram, and scatter plots. It is the foundation for many higher-level visualization tools.
scikit-learn
A Python library for classical machine learning, offering algorithms for regression, classification, clustering, and tools for model evaluation and pipelines.
+1 more flashcards
Responsible Data Science: Ethics, Bias, and Real-World Impact
Data privacy
Respecting people’s control over their personal information, including what is collected, how it is used, and who can access it.
Consent
A person’s informed, voluntary agreement to a specific use of their data, with the ability to refuse or withdraw without unfair penalty.
Sampling bias
Bias that occurs when the data collected does not represent the full population, causing models to work better for some groups than others.
Historical bias
Bias that comes from past inequalities or discrimination that are recorded in the data and then learned by models.
Measurement (labeling) bias
Bias introduced when the way outcomes are measured or labeled does not truly reflect what we care about, often favoring some groups.
Fairness (in models)
The idea that similar individuals should be treated similarly and that no group should be systematically disadvantaged by a model.
+2 more flashcards